U
User482
Guest
A list of Steve's daily distances is available here: https://frrt.org/tg/riders

A list of Steve's daily distances is available here: https://frrt.org/tg/riders
If it bothers you, you could compile a spreadsheet using the Strava data - all the rides are logged there.That's the so-called Ivanoscope, which is about the best I've found and which I've linked to several times on here.
However, it doesn't include the first couple of rides because Ivan, the designer, didn't get it fired up in time.
So if you added all the distances you'd have a wrong total, and if you divided them you'd have a wrong average.
Given that at best Steve will be close to matching Amanda, availability of the correct figures is important for those of wanting to follow the arithmetic of the attempt.
If it bothers you, you could compile a spreadsheet using the Strava data - all the rides are logged there.
For someone who's not bothered you're doing a remarkable impression of someone who's bothered!I'm not bothered, and my knowledge of spreadsheets is too limited.
But this does at least bring us back to the original point - lack of official information for fans to follow the attempt.
This is exactly the sort of stuff that would be great coming from the man himself and his team. Last time @jo from the other place did something similar, if rather whizzier, but I think he's said that he doesn't have the time this time around.Well, here are some stats and pics. I can post these regularly. But not daily, as the download is a bit of a faff.
I can add anything that's on Strava, like cadence and HR (even Kudos count), but I think boring old distance is the thing to show. There are lots of things that are possible - My favourite graphic that I produced during Kajsa's year was a graph showing a positive correlation between her daily distance and the number of times she mentioned the word "scone" in her ride descriptions.
Days: 25
Dist: 9,052 km / 5,625 mi
Avg daily dist: 362.1 km / 225.0 mi
Avg daily elevation (Strava): 1,617 m / 5,306 ft
Moving speed (Strava): 25.5 km/h / 15.9 mi/h
Hours per day riding: 15.1
Projected total at current daily rate: 132,162 km / 82,122 mi
View attachment 344644
View attachment 344646
Notes
This is based on simple analysis of Strava data.
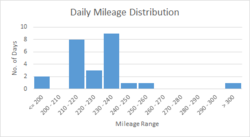
Miles are allocated to the day in which the ride starts. Where a ride crosses midnight, the starting day is credited with the mileage. This is not really relevant for average totals, but for daily mileage distributions may skew things a bit.
The "moving average" speed is based on what Strava considers to be moving time.
The hours per day riding is based on the duration of the Strava rides. If Steve splits a day into two parts either side of lunch then lunch will not be included. If he submits one ride for the whole day, it will.
Elevation gain is as reported by Strava.
I am fallible. This may be all totally wrong.
Maybe they don't have time, or have more important matters to attend to.This is exactly the sort of stuff that would be great coming from the man himself and his team. Last time @jo from the other place did something similar, if rather whizzier, but I think he's said that he doesn't have the time this time around.
Probably. But what we learned from Kajsa's year, and from the IPWR, is that putting information out in the real world in a digestible format attracts viewers. And viewers mean sponsorship.Maybe they don't have time, or have more important matters to attend to.
The data's there in Strava for anyone who wants to see.
I guess it comes down to resources and priorities. I'll leave Steve and his team to make their own decisions on that.Probably. But what we learned from Kajsa's year, and from the IPWR, is that putting information out in the real world in a digestible format attracts viewers. And viewers mean sponsorship.
Yes. "Rolling Average" was the wrong description for it. I was thinking about numbers not words. Overall average would be better.Nice work @Dogtrousers, as always.
I presume the rolling average line is the average miles per day so far, so it will naturally become more stable as time goes on. At the moment it's falling, not unexpected as the extra miles from the first day are spread ever more thinly.
However, what I'm finding is that if the analysis starts on day two - sustainable output if you like - the daily average is also trending downwards. It's about 221 miles now. In my attempt at pretty pictures, this is the line I'm looking at most closely.
Didn't Steve publish his monthly averages for this attempt (can't seem to find them)? If so, where is 215-220mpd in relation to this?
Thanks. I'll add that schedule as a line on my graph